Reading the Status Page
The StatiBeat homepage is built to help people understand service health quickly without needing admin knowledge.
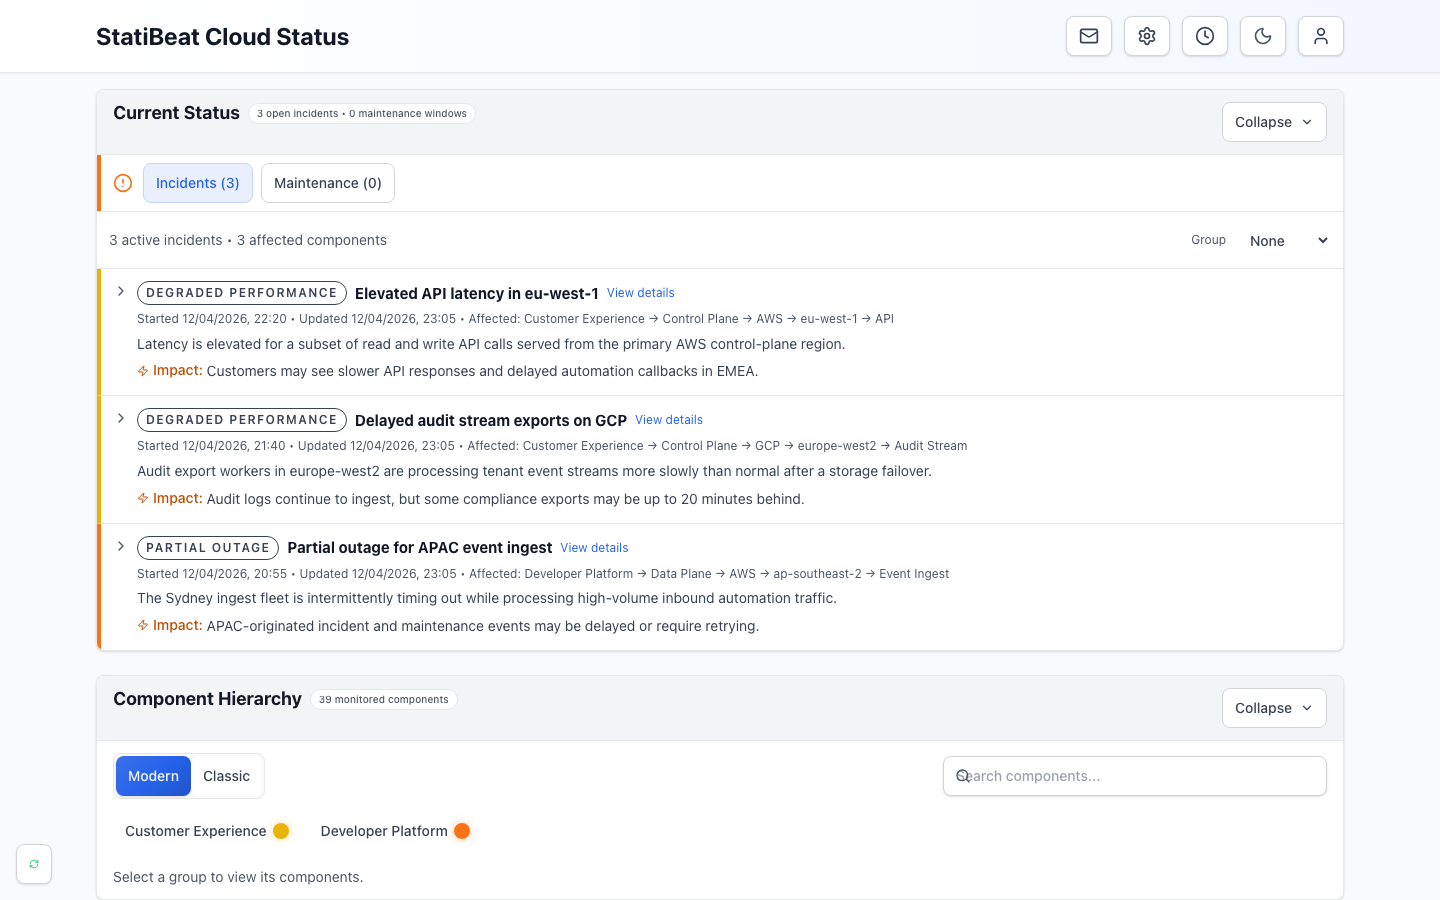
- Current statusSummarizes open incidents and maintenance at the top of the page.
- Active incidentsExplains customer impact, affected services, and the latest update.
- Component hierarchyLets readers browse the health of the products and services they use.
What to look for: the clip moves from Payments to EU West, where Checkout API is degraded while Billing Portal remains operational. The player controls let you pause or replay the example.
The main homepage sections
Depending on how the page is configured, you will usually see up to three sections:
Current status and live activityComponent hierarchyPrevious activity
The page owner can rename or hide sections, so treat these as a guide to the information—not a promise that every page will look identical.
Current status and live activity
This is the fastest answer to “is something wrong right now?”
It can show:
- an overall status summary
- active incidents
- active maintenance
- high-level impact messaging
If there is an active issue, start here before drilling into the hierarchy.
Component hierarchy
The hierarchy is the structured view of services, regions, products, and components.
This is where StatiBeat helps you answer:
- which part of the platform is affected
- whether the issue is broad or isolated
- how one component fits into the larger service model
Previous activity
This section helps you understand what happened recently, even if nothing is active right now.
It is useful for:
- checking whether an issue is already resolved
- reviewing the timeline of recent maintenance
- understanding whether problems are recurring
Tree View vs Basic View
StatiBeat supports two homepage hierarchy browsing modes.
Tree View
Tree View is the concise structural view.
Use it when you want to:
- scan the hierarchy quickly
- understand the parent-child structure clearly
- move through large service trees without extra visual noise
Basic View
Basic View is the flatter expandable layout with inline nesting.
Use it when you want to:
- expand just the branches you care about
- focus on a smaller subset of the service
- inspect nested status rows without reading a full tree all at once
If the page allows user preference overrides, you can often choose the mode that feels easier for you to read.
What the status indicators mean
Status indicators usually reflect one of these situations:
- the service is healthy
- the service is degraded
- part of the service is unavailable
- there is a larger outage or active maintenance
The exact labels and colors depend on how the page admins configured status types, but the principle is consistent: higher-severity issues should stand out clearly.
Do not rely on color alone. Read the status label and the accompanying text, especially if you use a screen magnifier, a high-contrast mode, or a colour-blindness setting.
Clicking into detail pages
From the homepage you can usually navigate to:
- a service or component detail page
- an incident detail page
- a maintenance detail page
Use those detail pages when you need:
- the full message timeline
- started and updated timestamps
- more precise affected-scope information
Practical reading tips
- Start at the live activity cards before digging into history.
- Use the hierarchy to verify whether your team’s area is actually impacted.
- If the page feels too broad, ask whether there is a custom view for your service.
- If the page is private, authenticate first so the data can load.
The animation shows a public page with a degraded Checkout API nested under EU West. The surrounding Billing Portal remains operational, so the hierarchy makes the affected scope clear without requiring a reader to interpret color alone.